
Use the Workload & capacity report to understand how Inbox work is distributed, how much capacity is being consumed, and where the current queue needs attention.
Open it from the Workload & capacity report card under Operations & Experience on the Dashboard.
How this report counts results
This report combines historical work from the selected period with a live operational snapshot. The date selector does not control every section in the same way:
- Handled counts distinct conversations with human handling that overlaps the selected period.
- Resolved uses when a human-resolved interaction ended.
- Active load, concurrency, capacity pressure, and session efficiency use handling or session intervals that overlap the period.
- In Operational Pressure, Unanswered, Oldest waiting, and SLA risk show the current queue; Utilization and Concurrent use the selected period, while Burn combines both sources.
For example, a conversation handled on April 8 and 9 and resolved by a person on April 10 appears in Handled for both days, but only once in the April 8–10 total; it appears in Resolved on April 10. If another conversation now has an unresolved SLA response cycle, that wait remains current as you change dates, while Utilization, Concurrent, and Burn may change.
This report does not wait for an attribution window to mature. Historical values can still change if conversation ownership, lifecycle events, or session records are corrected.
Read the main metrics
Select a metric to update the timeline and available breakdowns.
In this fictional account, Custom is selected for September 11–24, 2026. The cards show Active load 20.3% selected, Handled 27, Resolved 39, and Avg. concurrent 1.5. Their green indicators show favorable comparisons with the previous period.
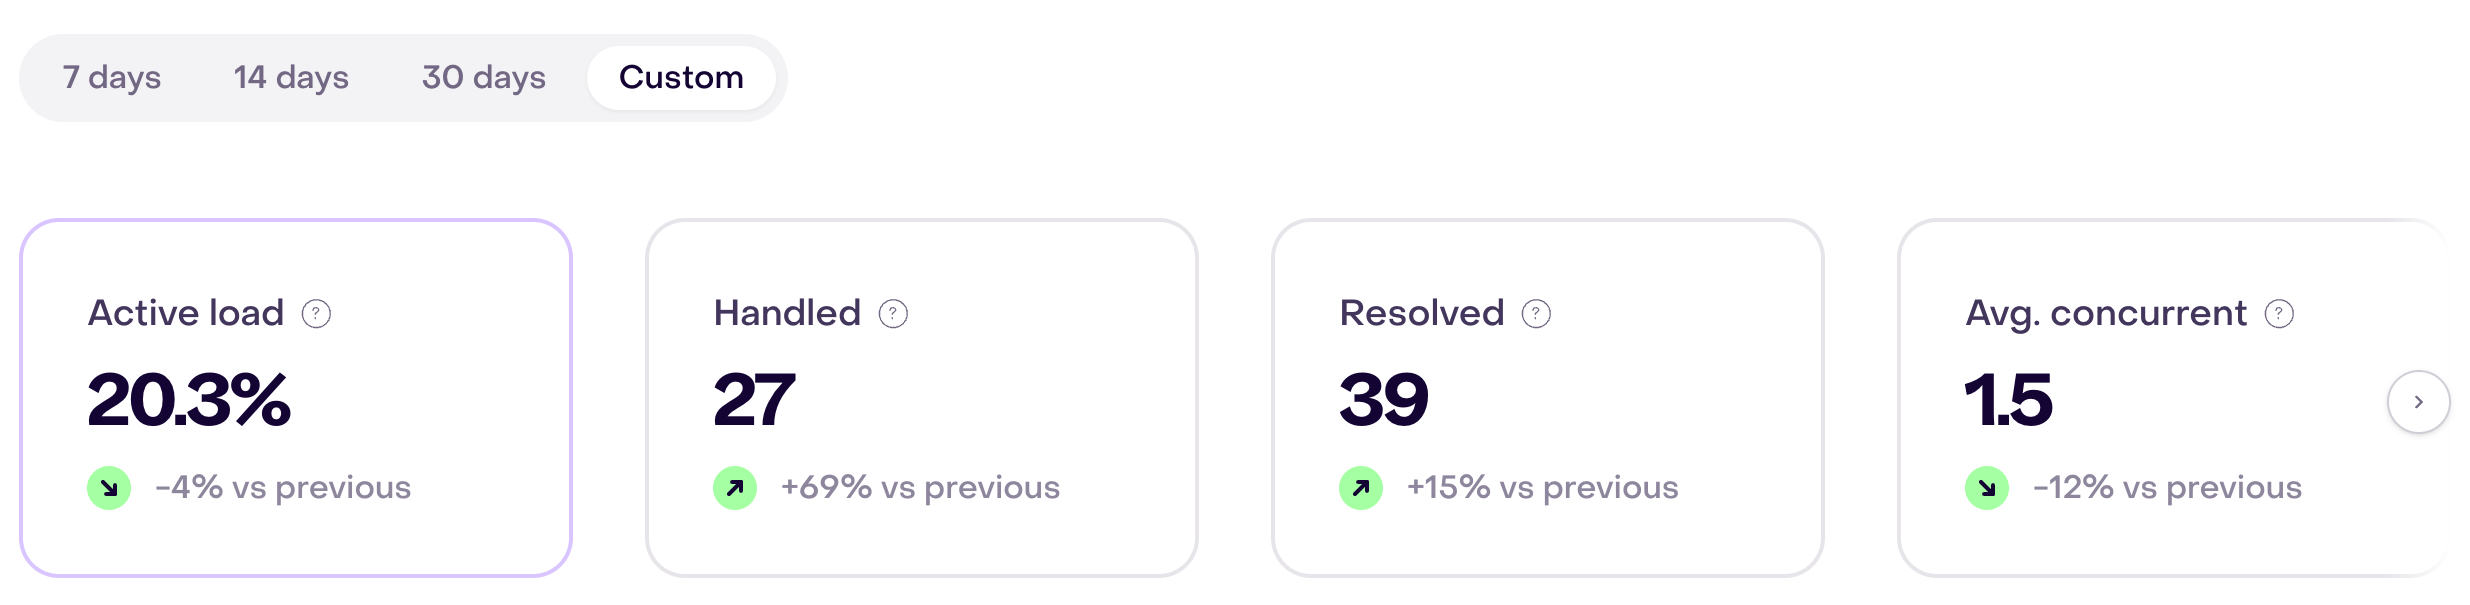
Active load
The percentage of available handling capacity consumed by recorded handling time during the selected period. Available capacity adds each session’s duration multiplied by the concurrent-conversation limit saved for that session.
It does not count conversations assigned or visible now. Compare it with capacity pressure, response health, and the current queue before deciding that a team is overloaded.
Handled
The number of distinct conversations with a human handling interval that overlaps the selected period. A reply, internal note, or human close can start that interval during an active session.
A conversation can count on multiple days and in more than one teammate or team row if each handled it. The full-period total counts it once.
Resolved
The number of distinct conversations whose interaction ended with human resolution during the selected period. An AI-only resolution does not enter this metric.
Handled and Resolved use different facts and dates. Do not subtract one from the other to estimate the pending queue; review current conversations and waits separately.
Avg. concurrent
The average number of conversations handled at the same time during active handling in the selected period, not over all logged-in time.
High concurrency can be appropriate for short or simple conversations. Review it together with response times, SLA risk, and conversation quality instead of treating one target as correct for every team.
Assigned
The number of distinct conversations handled in the period under a teammate ownership interval that did not begin with a transfer from someone else.
That interval may have begun before the period and does not prove the teammate was the first owner of the entire conversation. This metric is available by teammate because it describes individual ownership.
Transferred to
The number of distinct conversations handled in the period under an ownership interval the selected teammate inherited from someone else. The transfer may have occurred before the period.
Transfers are not automatically a problem. Review repeated transfers when they suggest unclear routing, missing expertise, or ownership that starts in the wrong place.
Compare teammates and teams
Most metrics can be broken down by teammate or team. Assigned and Transferred to use teammate-level ownership.
Compare like with like. Different teams can receive different intents, channels, schedules, or conversation complexity. A higher volume does not by itself mean better performance, and a lower volume does not by itself mean unused capacity.
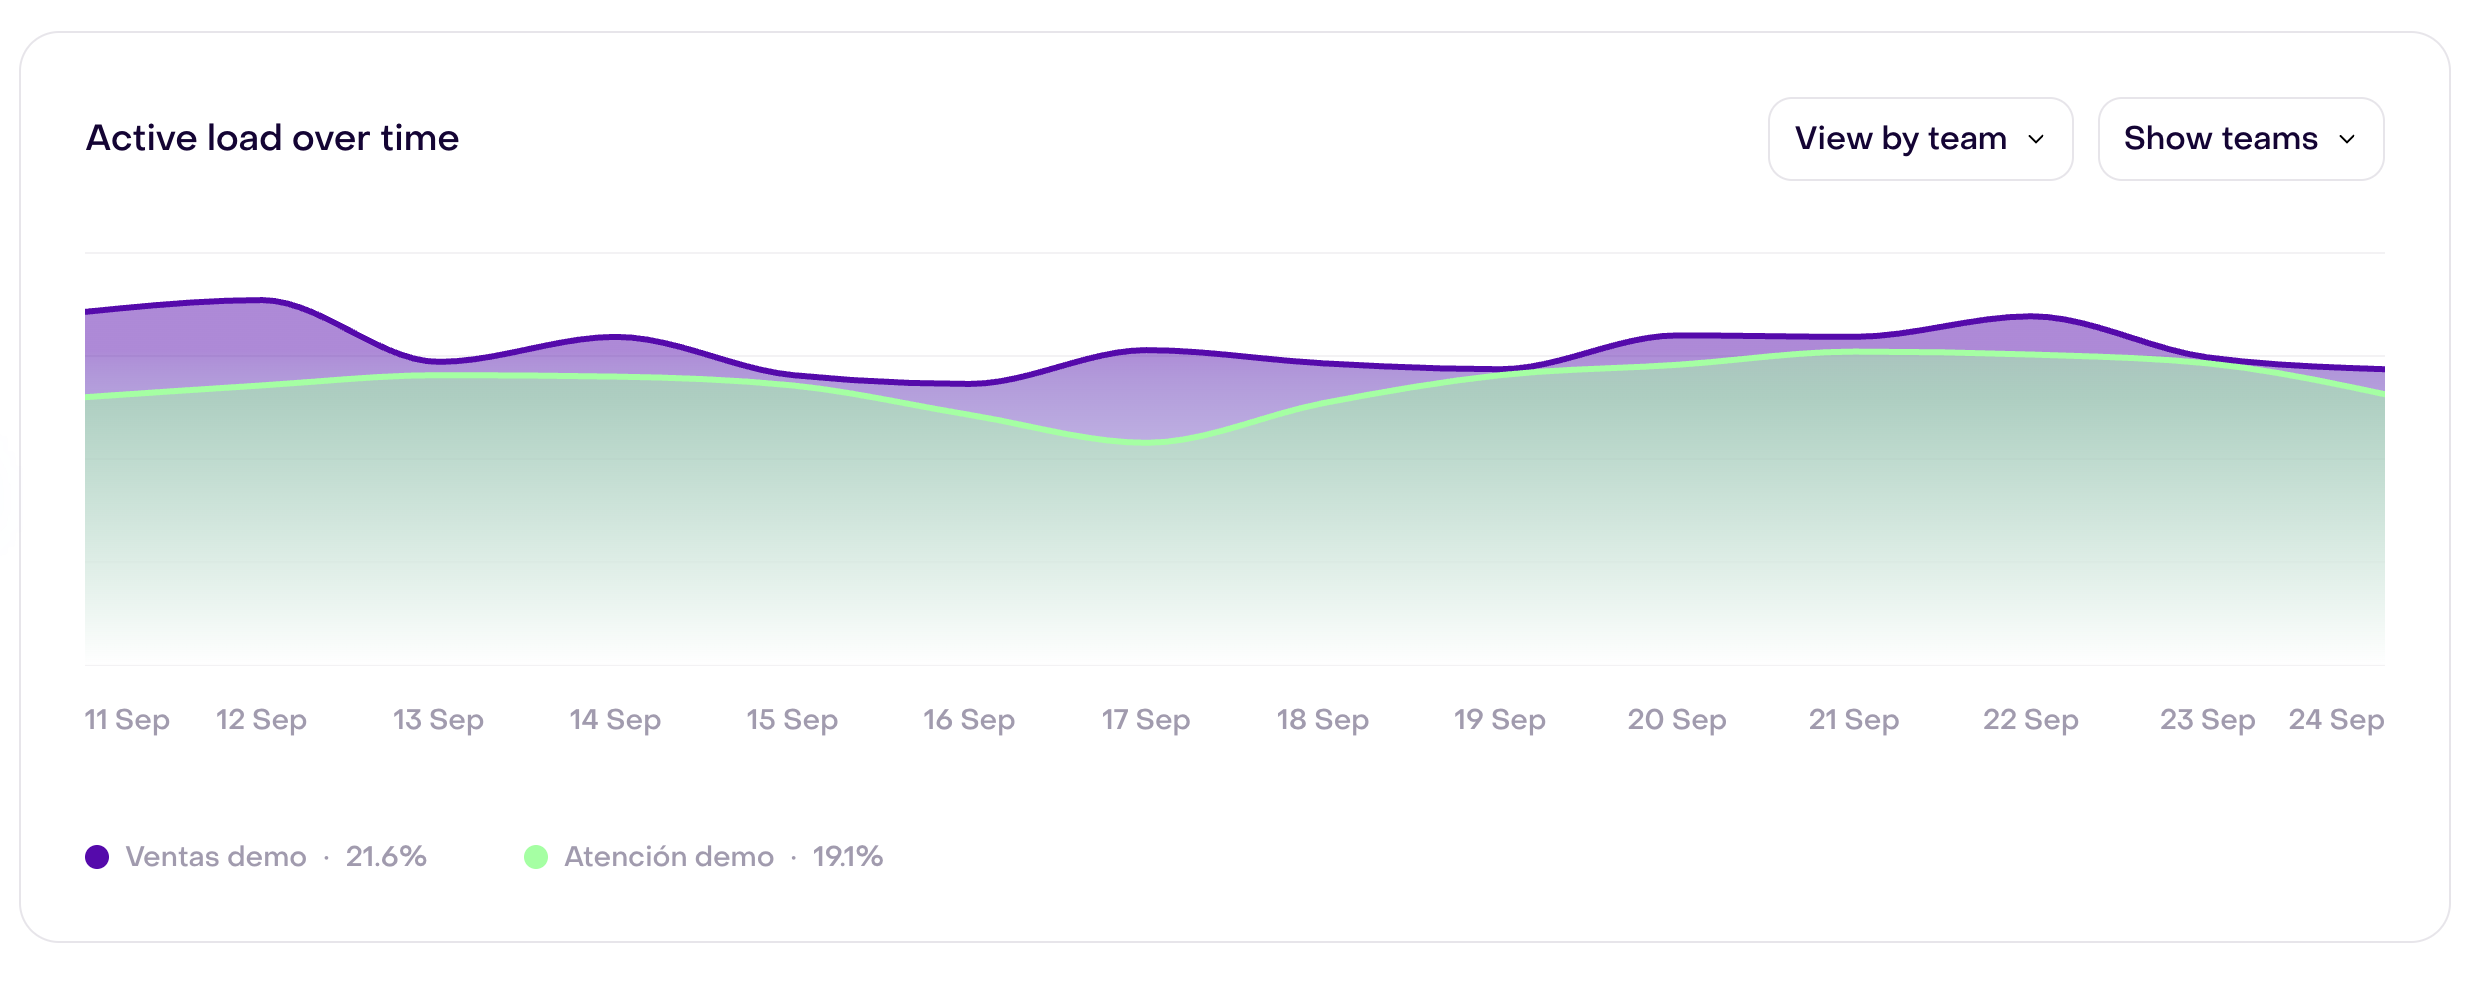
With Active load selected, View by team shows how two fictional teams changed from September 11 to 24, 2026. The legend summarizes 21.6% for Ventas demo and 19.1% for Atención demo across the full period.
Understand Capacity pressure
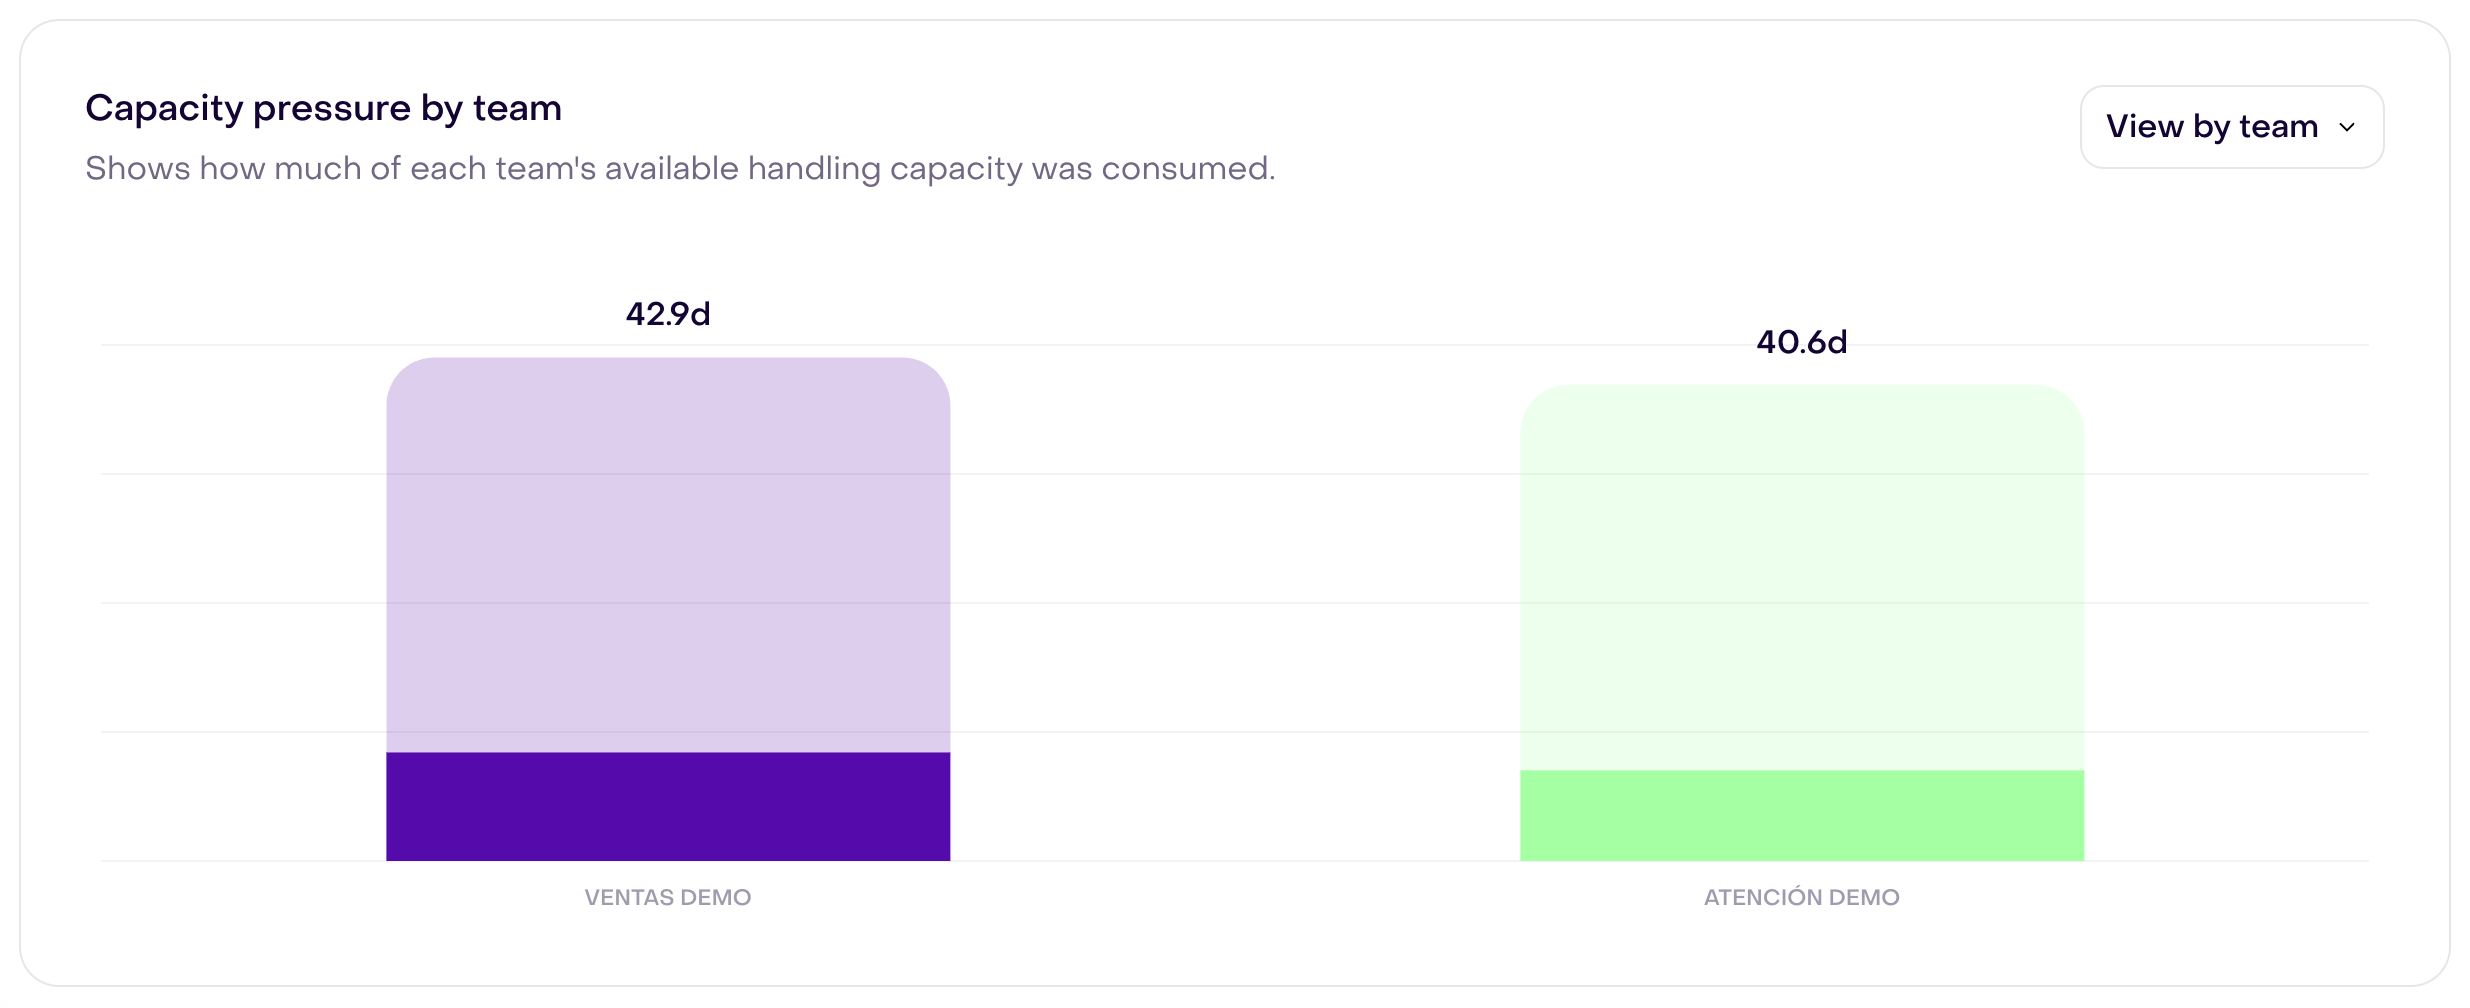
Capacity pressure compares consumed handling time with the available handling capacity represented in the selected period. You can view it by teammate or team.
Each bar shows:
- Available capacity: for each teammate, session time multiplied by the concurrent-conversation limit recorded for that session.
- Consumed capacity: the sum of conversation handling time during the period; two simultaneous conversations each contribute time.
- Pressure: consumed capacity as a percentage of available capacity.
The capacity shown depends on recorded sessions and their concurrent-conversation limits. A high percentage is a prompt to review the queue and response health, not proof that capacity should immediately be increased.
In team bars, the report shares a session’s capacity among the teams to which handling was attributed during the period. A team’s capacity therefore does not necessarily equal the sum of every complete session for its members.
In this example, Ventas demo has 42.9 days of attributed capacity and Atención demo has 40.6 days. The stronger-colored part of each bar shows consumed time.
Read Teams and Inbox capacity before changing these settings.
Understand Session efficiency
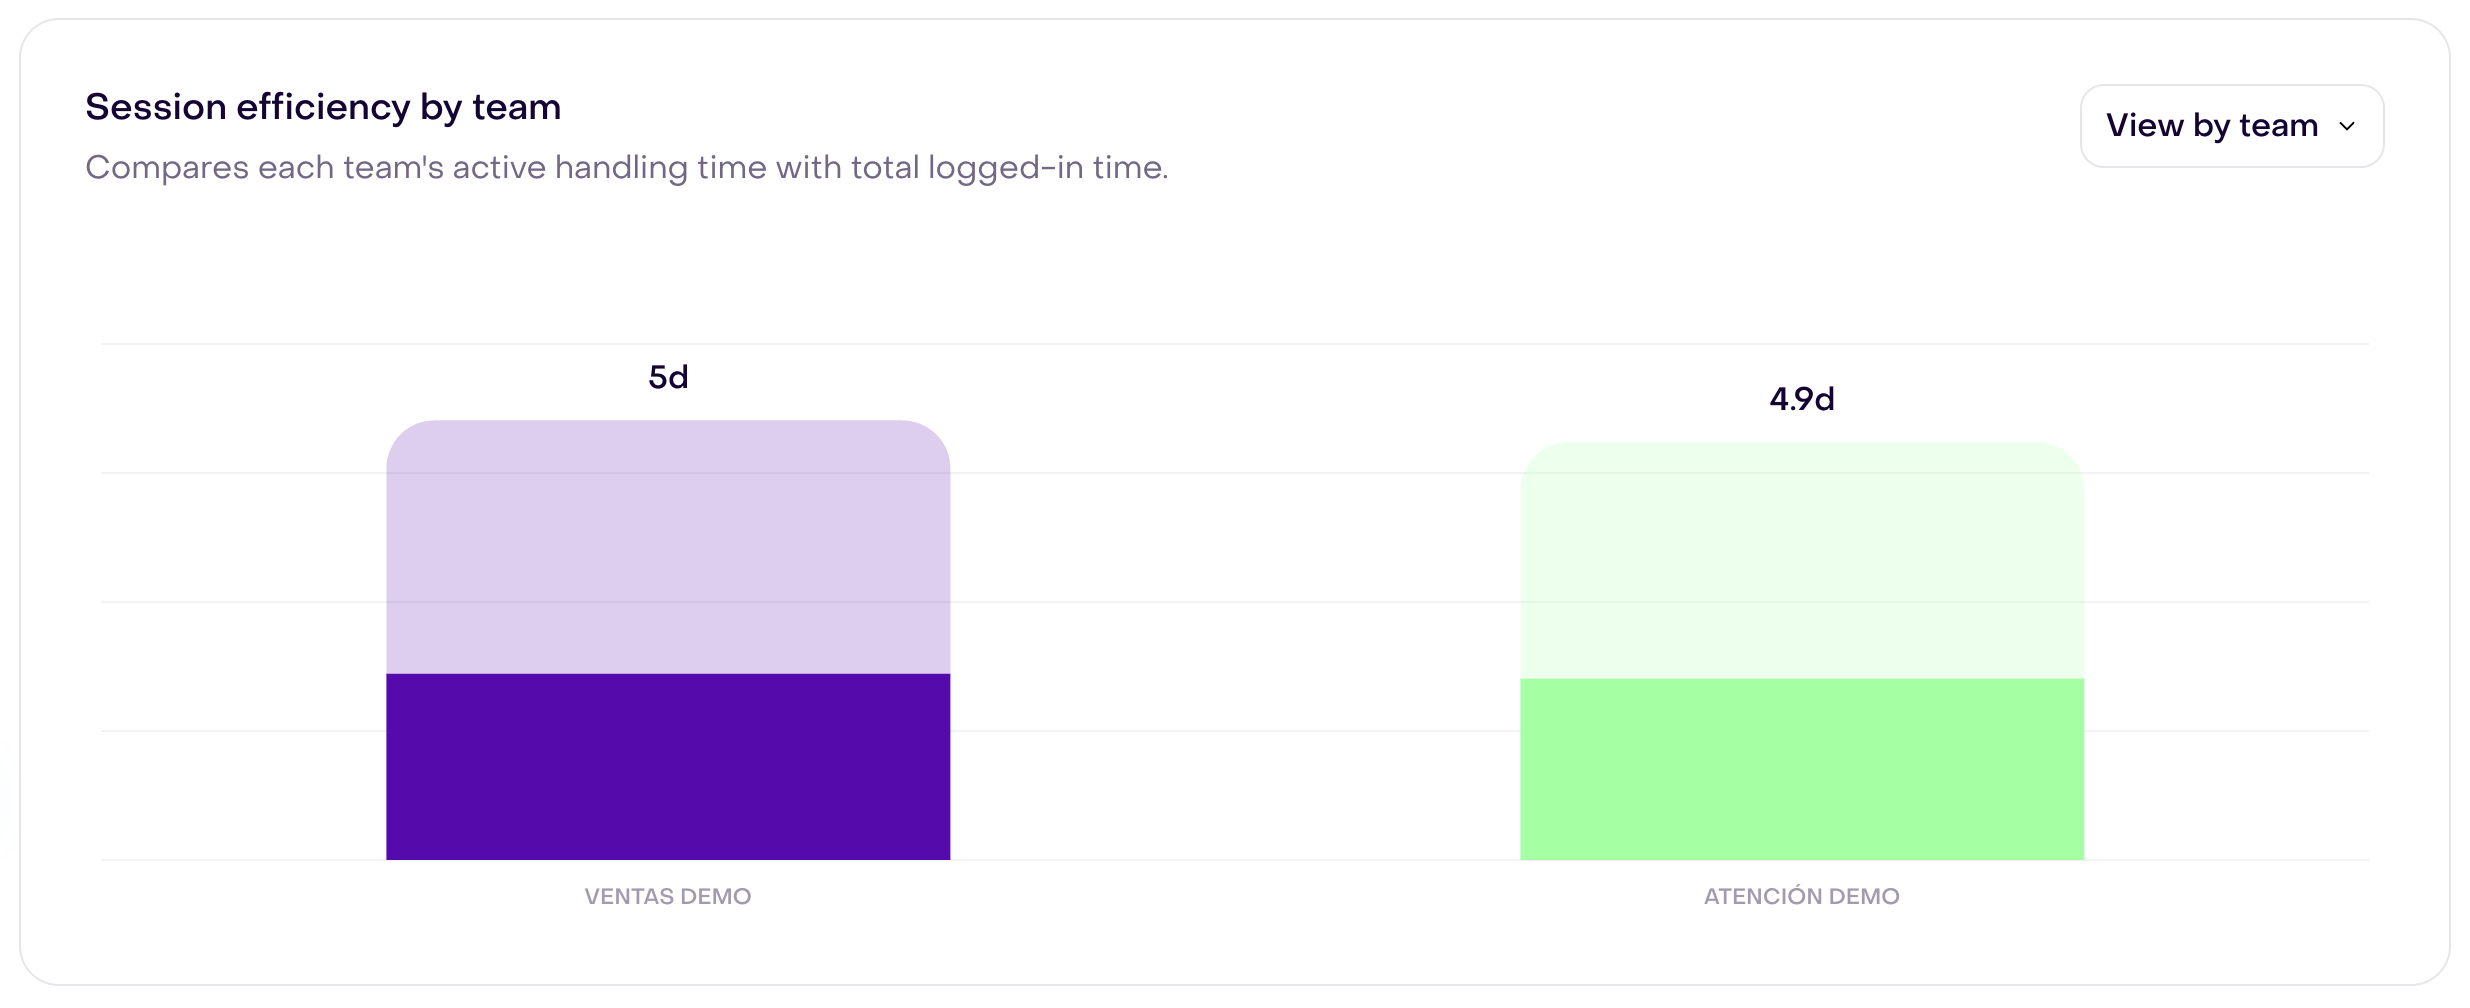
Session efficiency compares active handling time with total logged-in time for the selected period. It can be viewed by teammate or team.
The chart separates:
- Total logged-in time: the session time recorded during the period.
- Active time: wall-clock time spent actively handling conversations; overlapping intervals count once.
- Idle time: logged-in time without active conversation handling.
In the fictional data, the values above the bars show 5 days of active handling for Ventas demo and 4.9 days for Atención demo. The stronger-colored segment represents that active time; the lighter segment is idle time, and the complete bar represents total logged-in time.
Use this view to understand how recorded Inbox time was distributed. It is not a complete productivity score: meetings, breaks, administrative work, and responsibilities outside the Inbox may not appear as active handling time.
Illustrative example: a teammate is logged in for 60 minutes with a limit of two concurrent conversations. That provides 120 minutes of handling capacity. If the teammate handles two conversations at once for 30 minutes, 60 minutes of capacity are consumed: Active load and Capacity pressure are 50% for that teammate. Concurrency during active work is 2, while Session efficiency shows 30 active and 30 idle minutes.
Read Operational Pressure
Operational Pressure combines current response obligations with handling statistics from the selected period. Changing dates can alter Utilization, Concurrent, and Burn, but does not turn Unanswered, Oldest waiting, or SLA risk into historical values.
View it by teammate or team and use these columns:
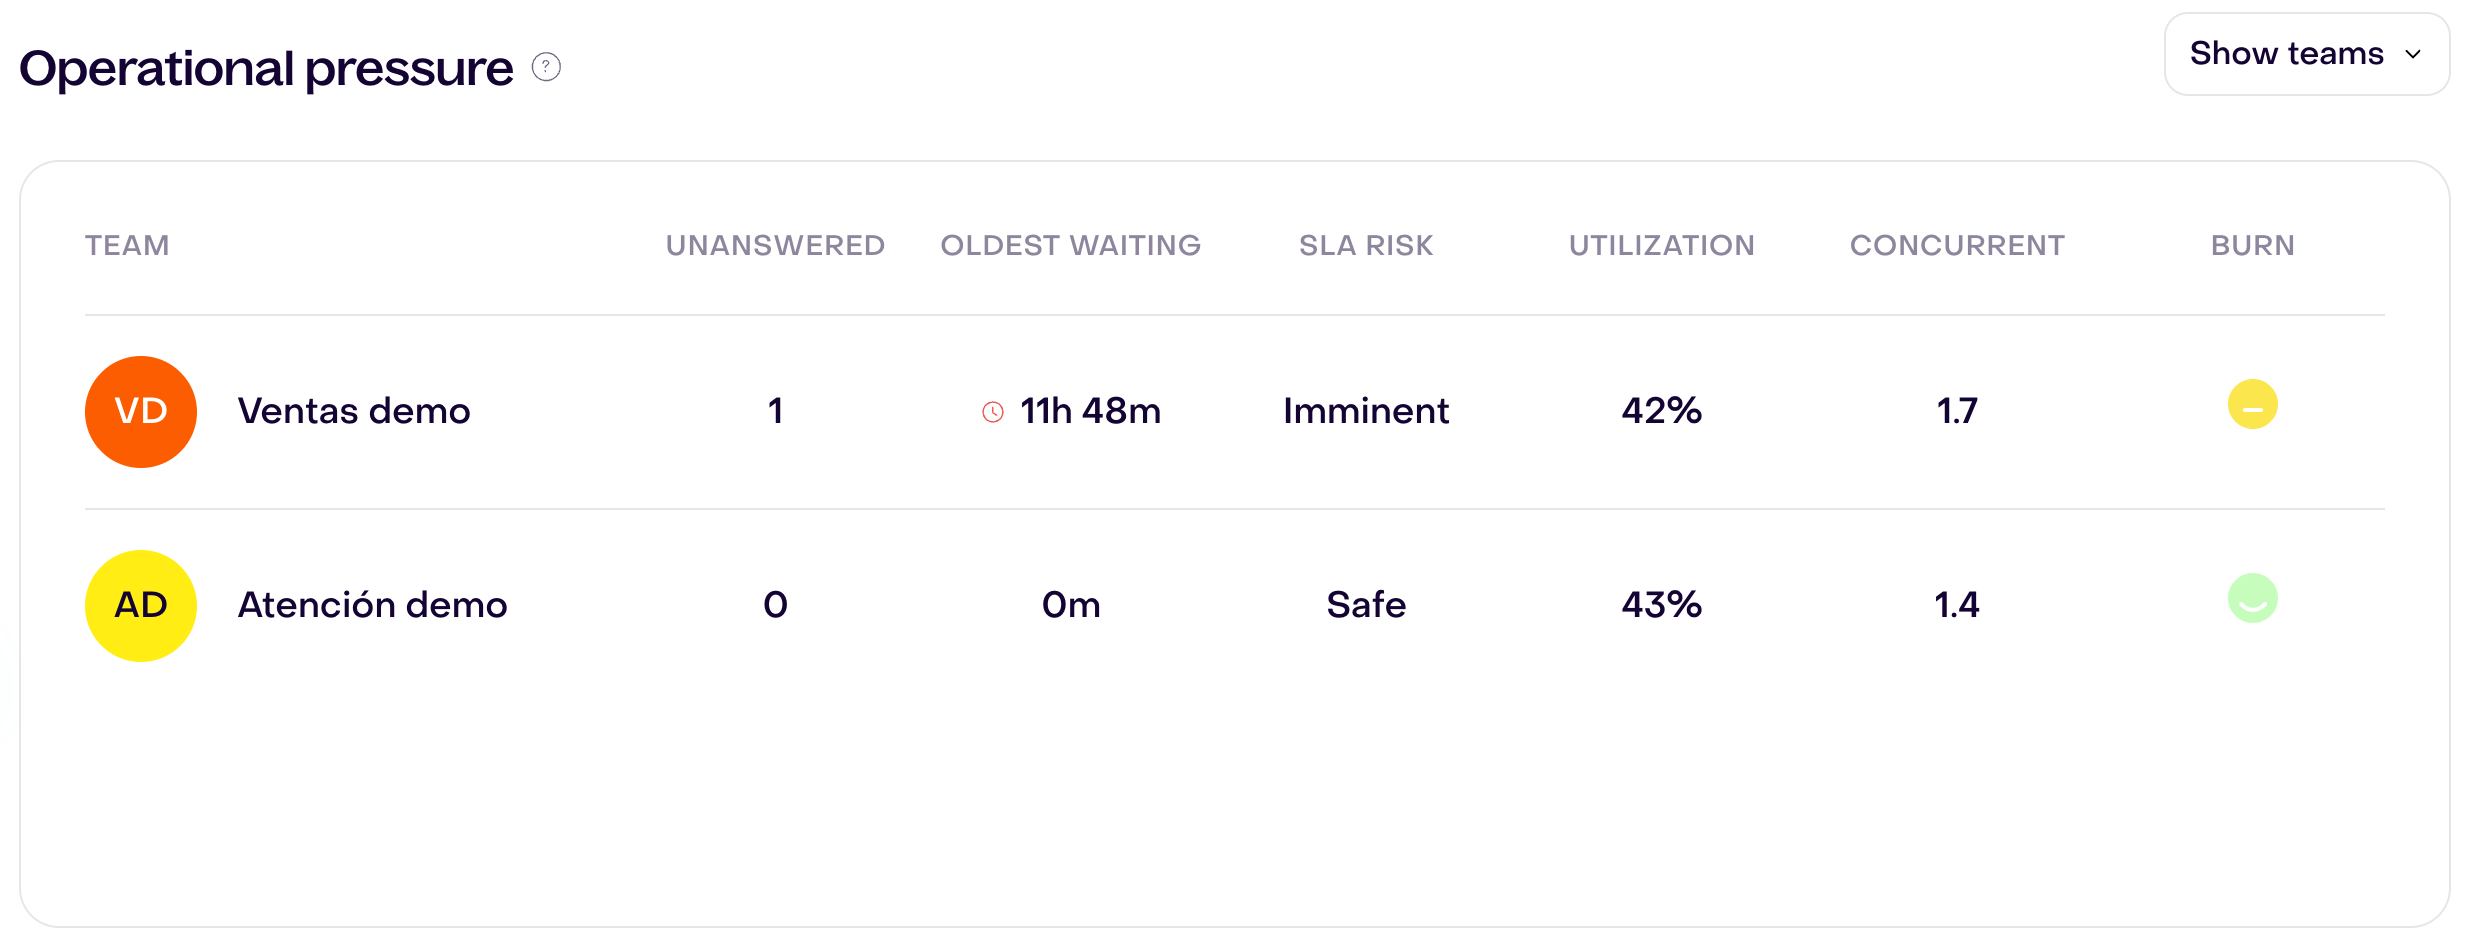
- Unanswered: current conversations with an active or breached SLA response cycle that has not been answered.
- Oldest waiting: the elapsed time of the oldest unresolved response cycle in that set.
- SLA risk: whether active response obligations are Safe, At risk, or Imminent.
- Utilization: the share of logged-in session time spent actively handling conversations during the selected period.
- Concurrent: average simultaneous conversations during active handling in the selected period.
- Burn: a signal combining period Utilization and Concurrent with current SLA pressure. Its states are Normal, Watch, and At risk.
In the capture, Ventas demo has 1 unanswered conversation, an 11 h 48 m oldest wait, and Imminent SLA risk; Atención demo has 0 unanswered, a 0 m wait, and Safe risk. Those are queue values at capture time. Period values are 42% Utilization and 1.7 Concurrent for Ventas demo, compared with 43% and 1.4 for Atención demo. Burn shows Watch for Ventas demo with a yellow neutral icon and Normal for Atención demo with a green smiling icon.
Burn is a blended signal, not a diagnosis or a performance rating for a person. Review current waiting conversations and consider schedules, routing, and capacity before taking action.
Turn the report into an action
| If you see… | Review… |
|---|---|
| Active load rising | Recorded handling time, sessions, and concurrency limits; then compare them with current waits and response health. |
| Handled staying above Resolved | Handling and resolution dates and intervals. The difference does not measure the pending queue; inspect that directly. |
| High concurrency with slower responses | Concurrent-conversation limits, conversation complexity, response rules, and staffing. |
| Transfers concentrated on one teammate | Routing destinations, team membership, expertise, and initial ownership. |
| Low recorded session efficiency | Whether the teammate was available for Inbox work and whether non-Inbox responsibilities explain the difference. |
| Unanswered or oldest waiting increasing | The live unassigned and assigned queues, teammate availability, and response health. |
| SLA risk or Burn worsening | Whether the current queue or selected period changed; review Business hours, response rules, routing, concurrency, and available capacity. |
Distinguish period columns from current-queue signals before deciding what needs attention.
When data is missing or unexpected
Confirm that:
- teams and teammate Inbox capacity modes are configured correctly;
- sessions have realistic recorded concurrent-conversation limits;
- assignments and transfers identify the correct owner;
- replies, internal notes, and human closes that start handling are recorded in Inbox;
- logged-in sessions and active handling intervals are recorded for the period;
- response rules and Business hours are configured when reviewing SLA risk; and
- both comparisons use the same date range, timezone, metric, and breakdown, separating current Operational Pressure signals from period data.
If the source records exist but the report remains inconsistent, follow Data completeness and reporting gaps.