
The Dashboard gives you a quick view of recent business activity and access to the reports used for deeper analysis. Use it to spot a change, then open the relevant report to understand its source.
The Dashboard combines four areas:
- a fixed 14-day overview;
- tracked customer actions;
- a campaign calendar; and
- business performance and operations reports.
Start with notices and onboarding
Hellotext can show an onboarding checklist or account notices above the metrics. Review these first because an incomplete connection, expired channel authorization, or account problem can affect sending and the data shown below.
Completing an onboarding step does not prove that historical data was imported or that every signal is arriving. After connecting a source, verify a recent customer, event, and order before relying on the Dashboard.
Read the 14-day overview
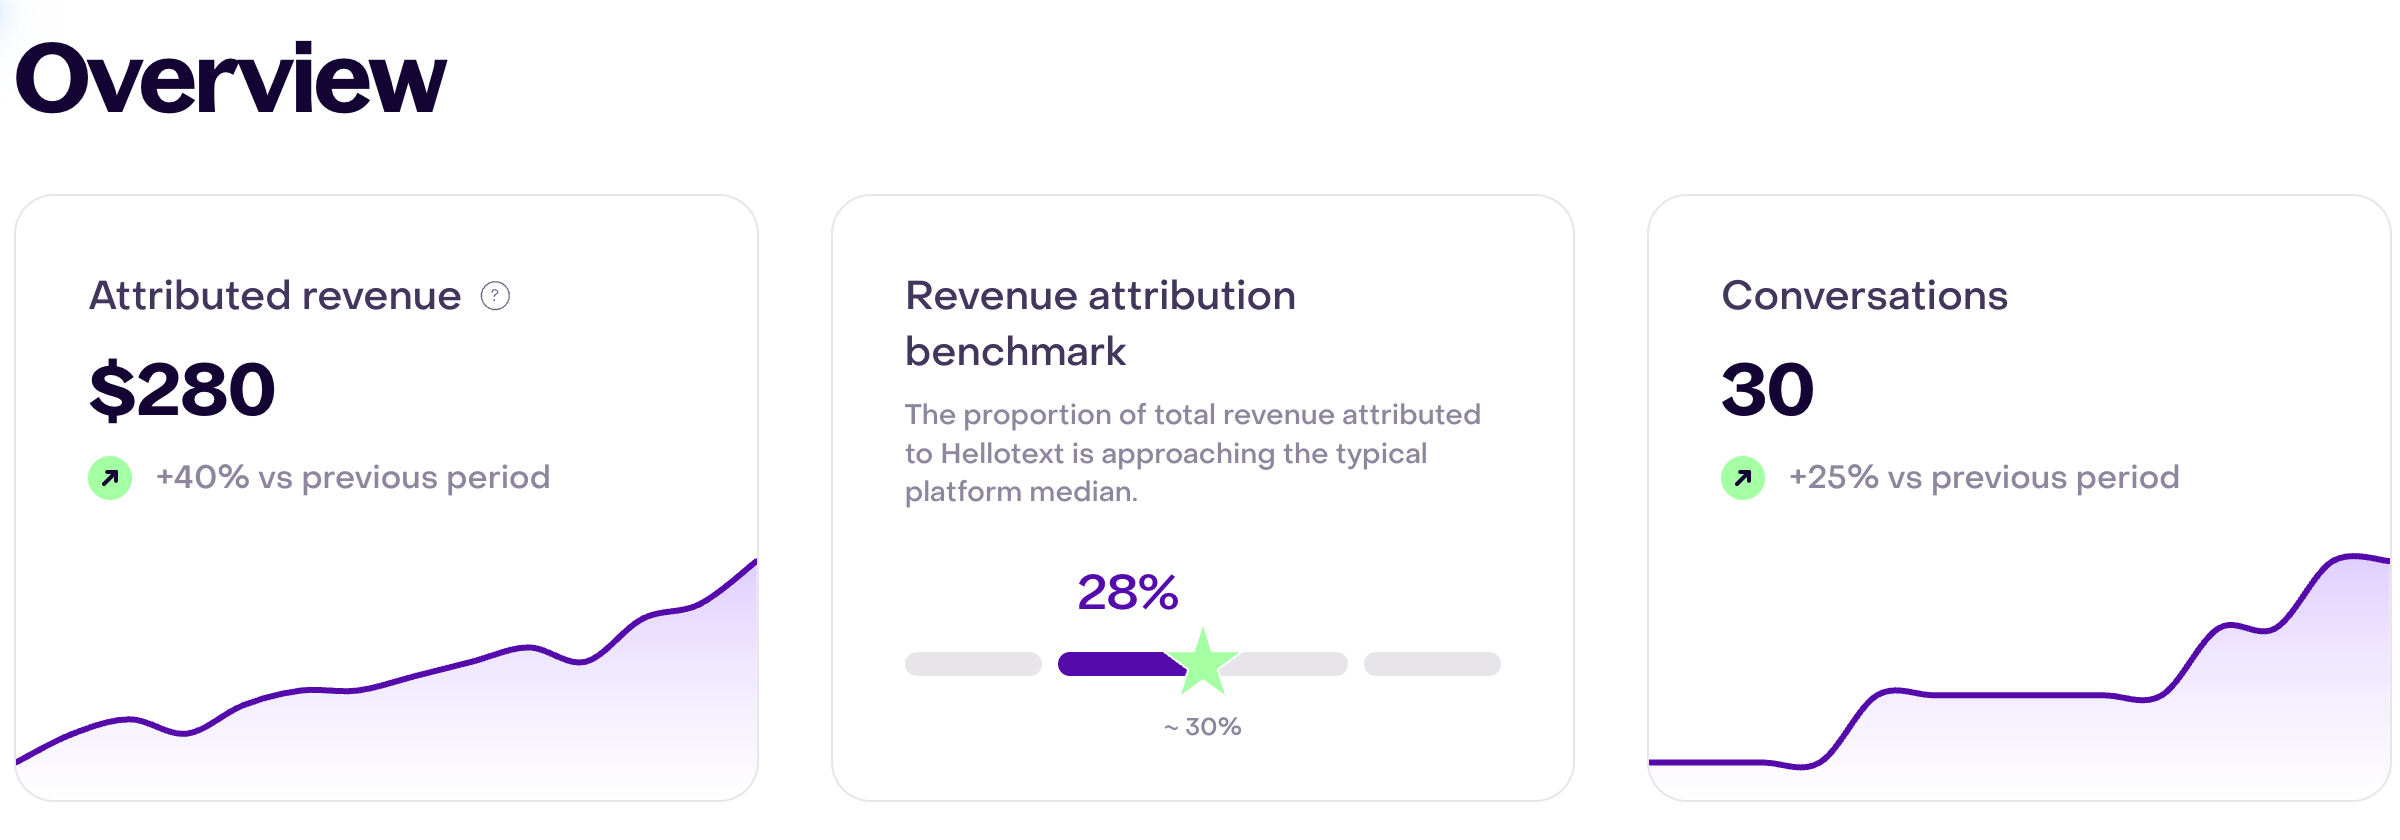
The overview cards always cover the current day and the previous 13 days. Their percentage change compares that total with the preceding 14-day period. The small chart shows the daily values inside the current period.
Changing the date inside a detailed report does not change these Dashboard cards.
The following screenshot uses demonstration data: $280 in attributed revenue, a 28% benchmark, and 30 conversations. The arrows compare the current period with the preceding 14 days.
Attributed revenue
Attributed revenue is the positive revenue Hellotext connected to eligible campaigns, routes, playbooks, or commercial interactions under its attribution rules and windows.
Select the card to open the Revenue report and inspect the result in more detail.
Attributed revenue is not the same as:
- all revenue recorded by the connected store;
- revenue merely influenced by a customer interaction; or
- incremental revenue that would not have happened without Hellotext.
See Sales attribution for the evidence, precedence, and time-window rules behind this value.
Revenue attribution benchmark
The Revenue attribution benchmark shows the percentage of total recorded revenue that was attributed to Hellotext during the same 14-day period.
The marker represents the typical platform benchmark. Use it as context, not as a guaranteed target. The result depends on the business model, active campaigns and playbooks, customer behavior, attribution evidence, and whether Hellotext receives complete order revenue.
This percentage can be empty when Hellotext has no total revenue for the period, even if another integration or external report contains sales.
Conversations
Conversations counts conversations started during the 14-day period.
It does not represent:
- the number of messages exchanged;
- unique customers;
- conversations currently waiting in Inbox; or
- conversations resolved by AI or the team.
Use the operations reports for resolution, SLA, assignment, and workload questions.
Empty values
A dash means Hellotext did not calculate a positive value for that card in the period. If a curve appears beside the dash, it illustrates the empty state; it does not represent recorded daily activity. Do not interpret an empty card as proof that nothing happened in the business. Confirm that the relevant channels, store, events, and identifiers are connected and sending data.
Understand the Actions table
The Actions table shows types with events recorded during the last 14 days. An action is the type of activity, such as a purchase, subscription, form submission, conversation event, or a custom action defined by the business. If more types are available, select Load more to show the next rows.
| Column | What it shows |
|---|---|
| Events | Number of recorded occurrences of the action. |
| Average value | Total monetary value recorded for the action divided by its occurrences. |
| Amount | Total monetary value recorded across those occurrences. |
In the demonstration example, product views have 160 events but no monetary value; the order action records 14 events, a $71.43 average value, and a $1,000 total amount.
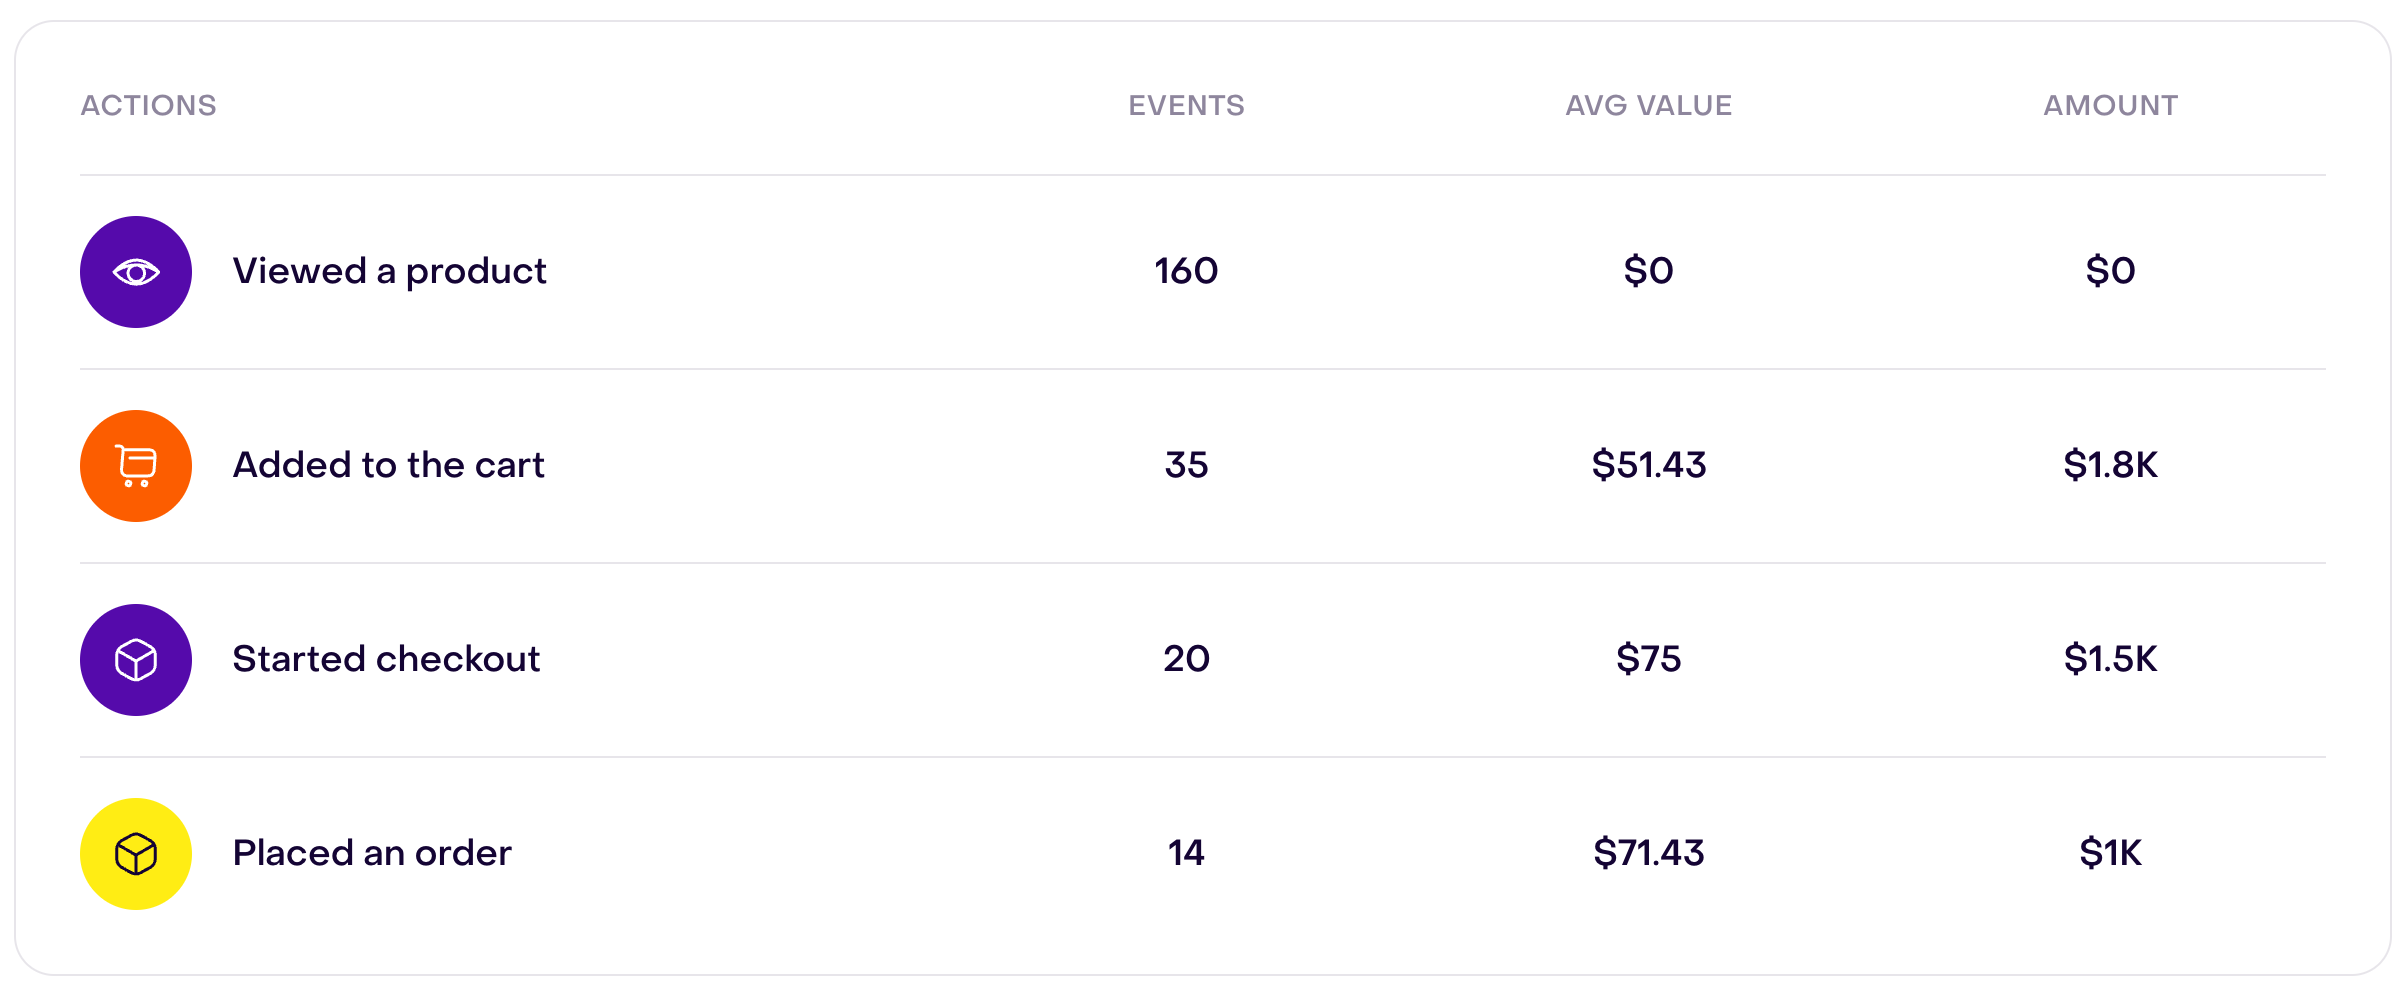
Select a column heading to sort the table by event volume, average value, or total amount.
Not every action carries money. A valid action can have events while its average value and amount remain empty or zero. If a custom action should include a value, verify that the integration sends the amount and currency in the event rather than adding them only to the action name.
The Actions table describes what Hellotext received. If it is empty, the blurred rows are visual examples, not events from your account. The table does not, by itself, attribute an action to a campaign or playbook. Use the corresponding report when source and attribution matter.
Use the campaign calendar
The calendar organizes scheduled and delivered campaigns by week.
- Move between weeks with the previous and next controls.
- On a computer, hover over a campaign to review its audience, recipient count, schedule or delivery time, channels, and creator.
- For delivered campaigns, the tooltip can also show attributed revenue and CTR.
- Select a scheduled campaign to continue editing it, or a delivered campaign to open its results.
In this example, the first week shows delivered campaigns in gray with a check mark. The second shows upcoming campaigns in colored cards. Use each column’s date to place a send; See more means there are additional campaigns on that day.
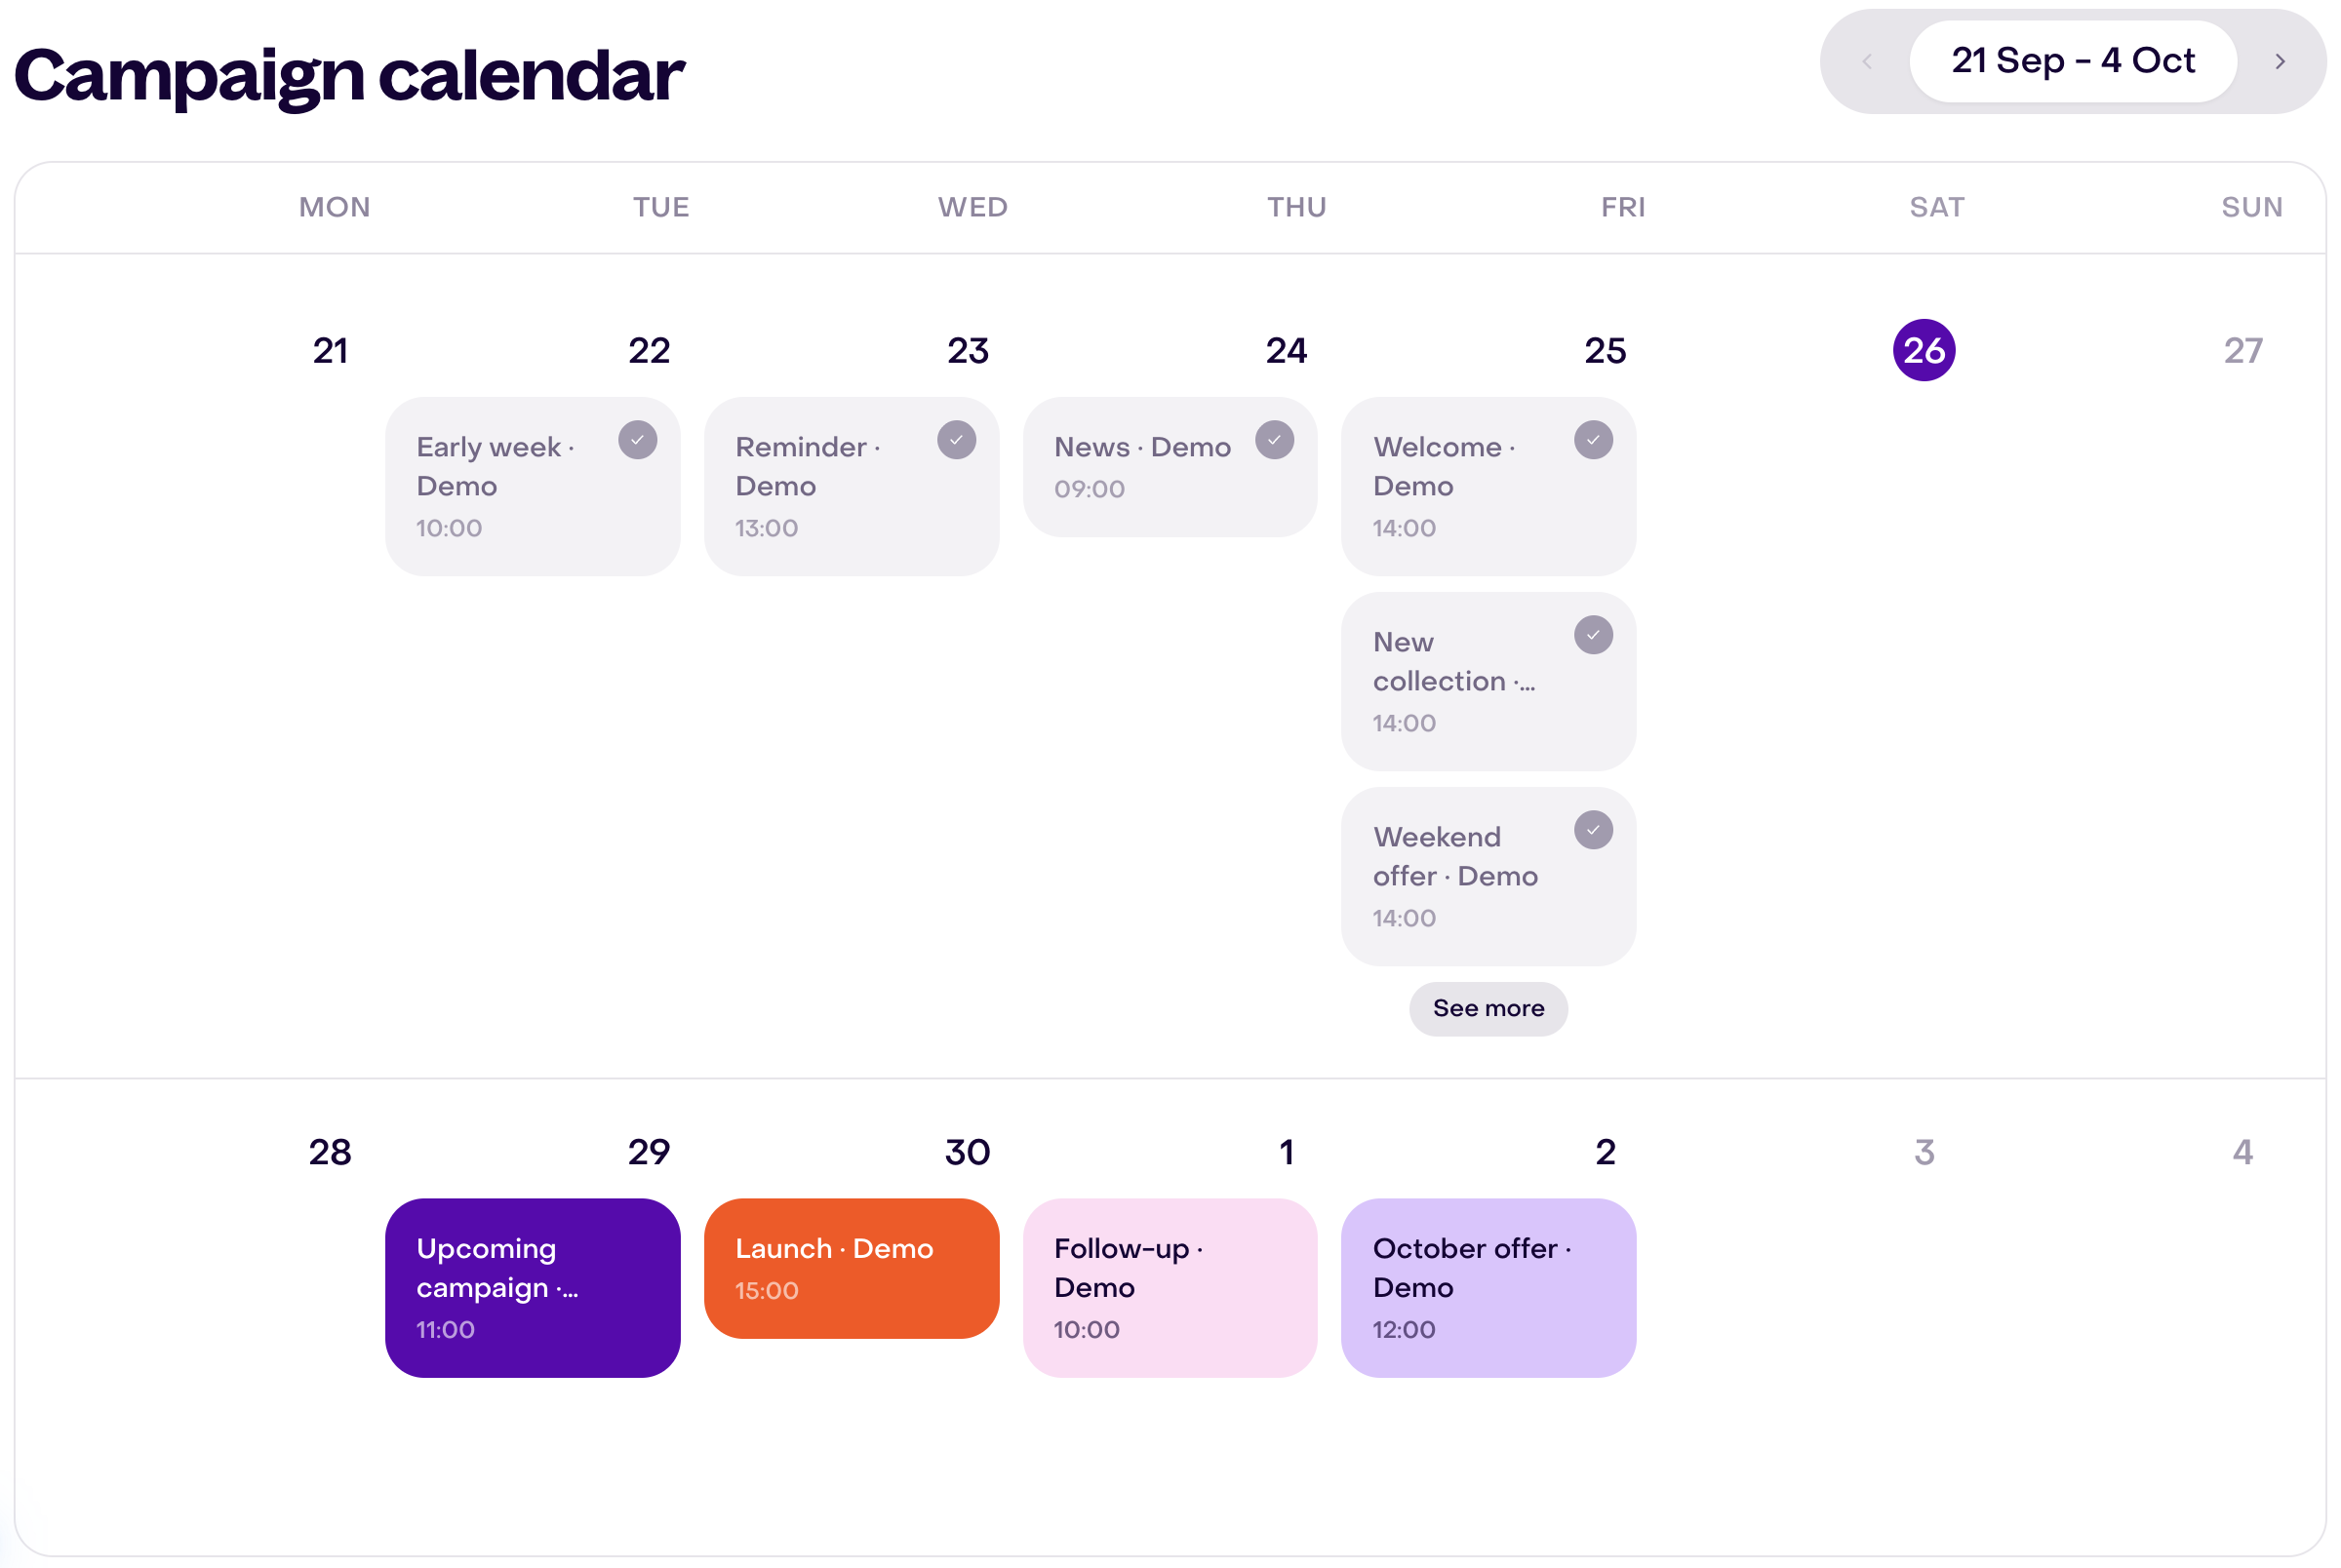
The calendar contains campaigns. It is not a complete schedule of every message a playbook, AI agent, or route may send.
Choose the right report
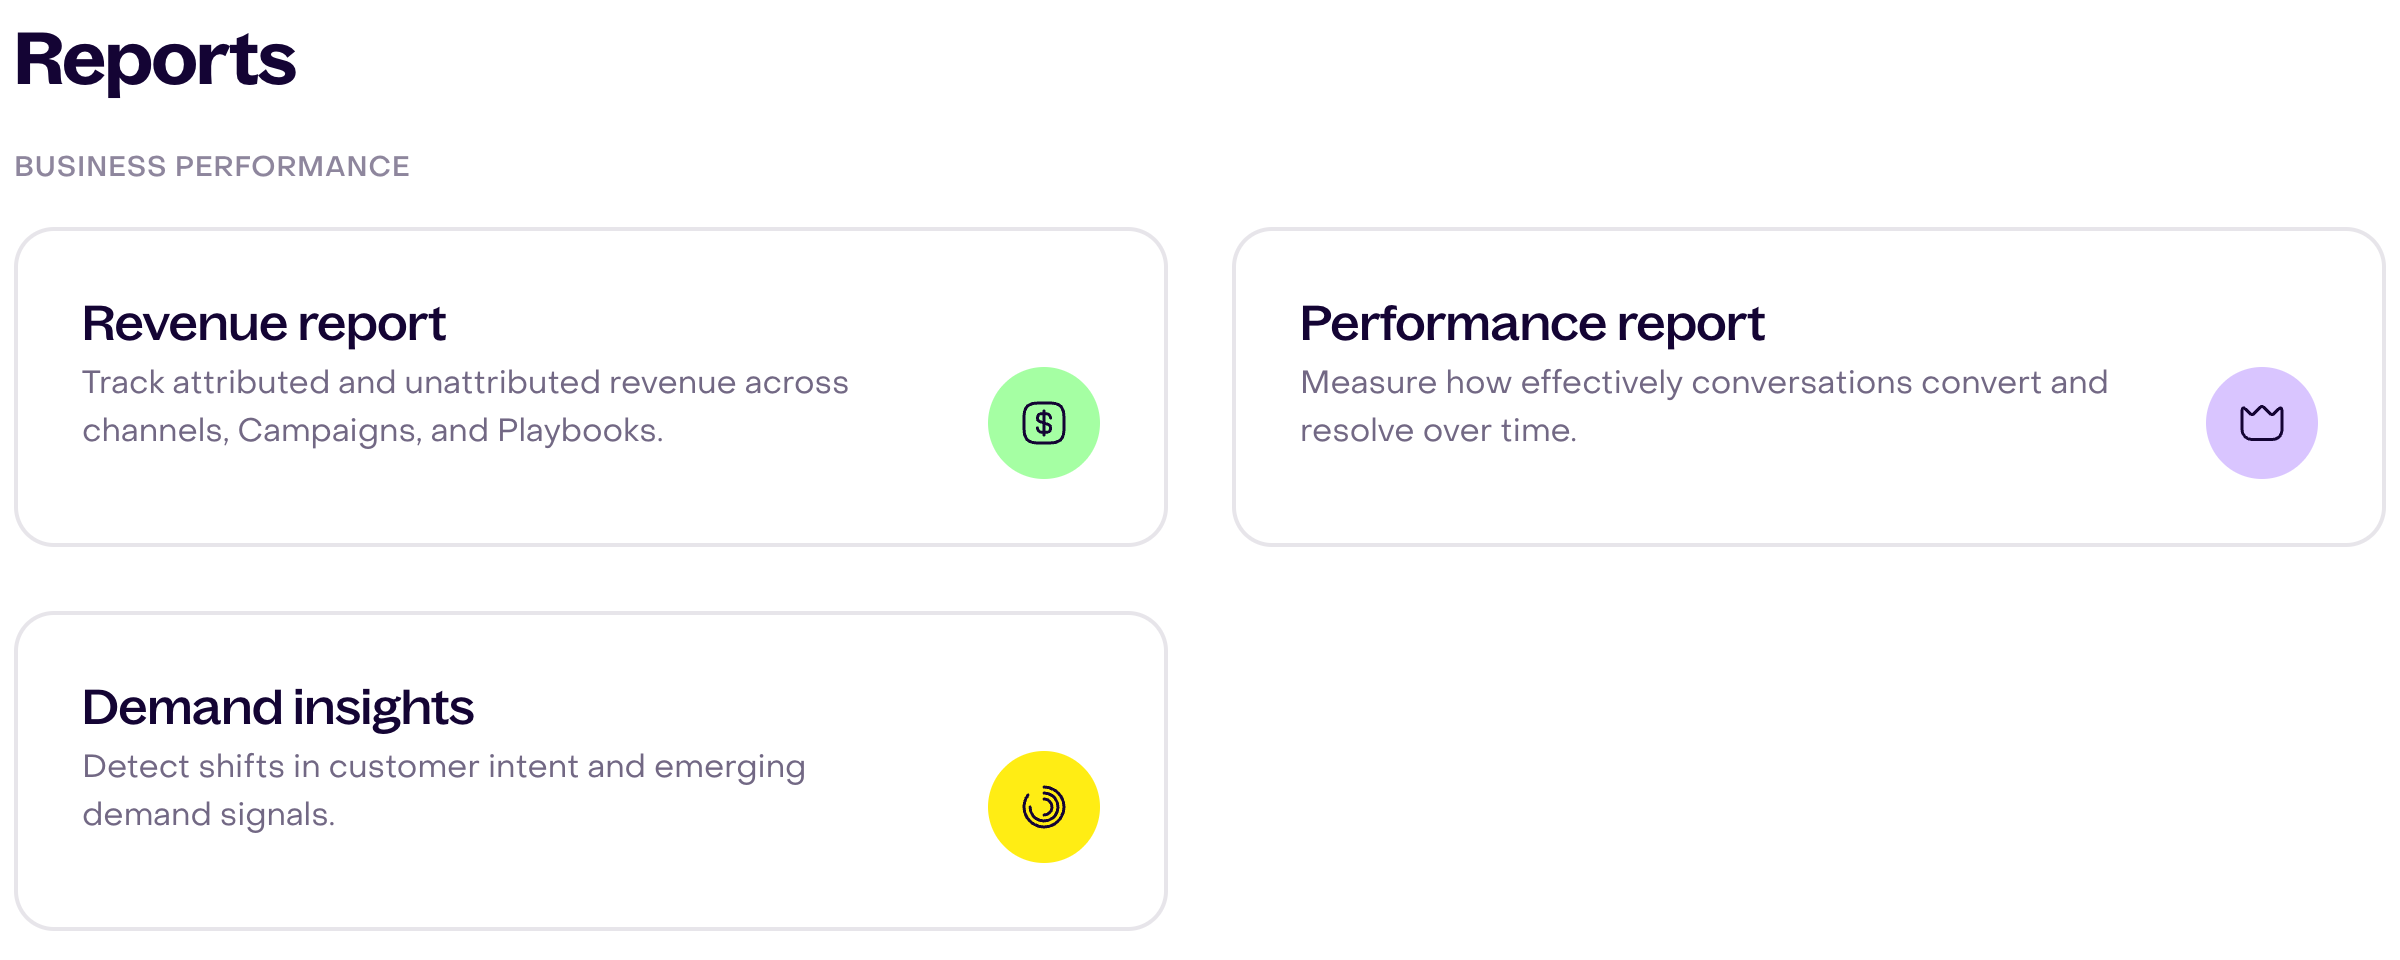
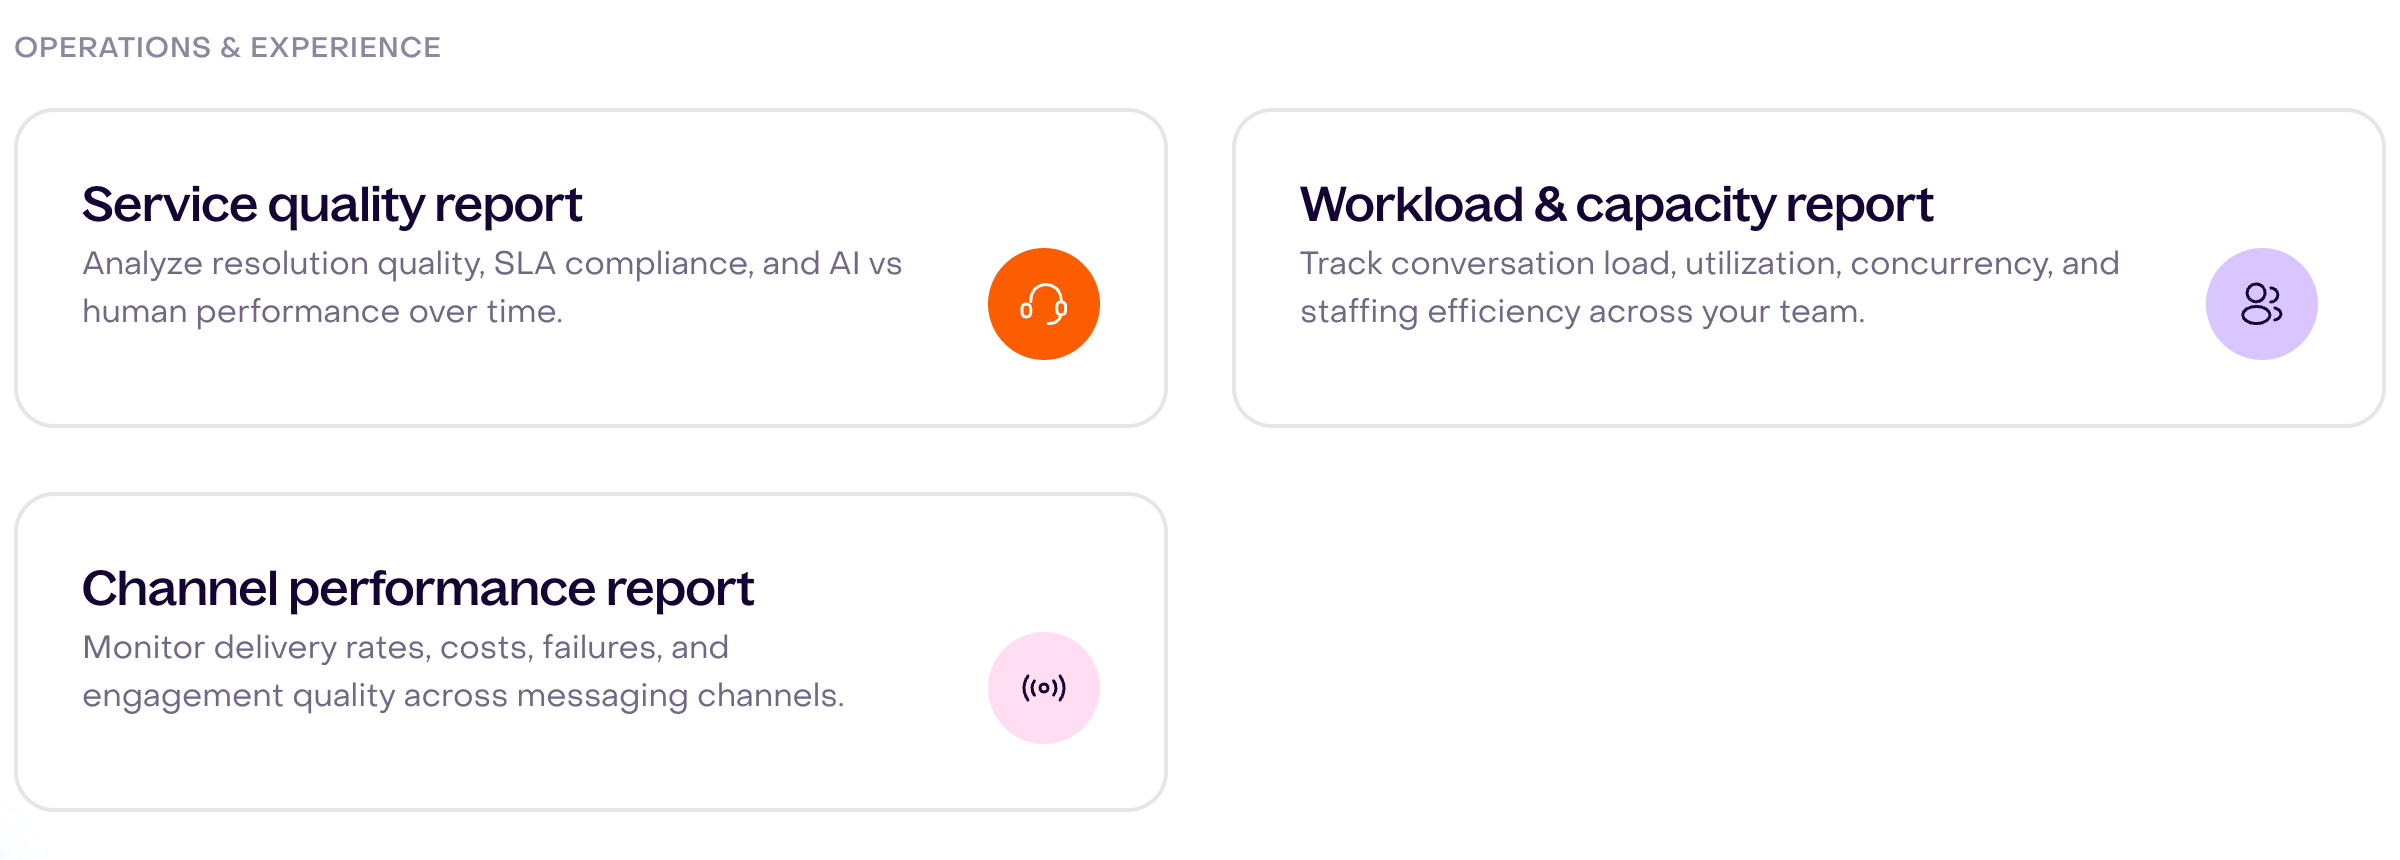
The report cards are divided into Business Performance and Operations & Experience.
| Report | Use it to answer |
|---|---|
| Revenue report | How much revenue was recorded, what was attributed to AI or the team, and which channels, playbooks, or campaigns received credit? |
| Performance report | How are conversion rate, time to conversion, and escalation rate changing? |
| Demand insights | How many interactions resolved by AI or teammates, or closed by automations, have no recorded conversion, and what revenue estimate does the report show? |
| Service quality report | How often did AI or the team resolve conversations, meet SLA, or leave conversations unresolved? |
| Workload & capacity report | How much work is assigned, handled, resolved, transferred, or active across teammates and teams? |
| Channel performance report | How do delivery, costs, failures, and engagement quality change across messaging channels? |
Open a report when you need to change the date range, select a metric, compare a breakdown, or inspect detailed rows. Available breakdowns depend on the report and metric.
Change a report period
Detailed reports have their own date selector. Common choices include 7, 14, or 30 days and a custom range, with additional calendar presets available in the custom picker.
When comparing reports:
- Use the same date range.
- Check which date the report uses to assign results.
- Apply the same channel or source breakdown.
- Allow current attribution windows to close before treating recent results as final.
The same outcome can appear on different dates because each metric has its own rule. In Playbook reports, sends, deliveries, and clicks use each event’s date; some revenue and conversion metrics group eligible purchases by the credited source-message date. Campaign detail counts each event on its date, including attributed purchases on purchase date. Revenue also uses purchase date; Performance groups interactions by start date. Current-state sections use their displayed time.
The operations report can also contain a live operational-pressure section. A live snapshot describes the current queue and is not limited by the historical date range selected for the report.
A practical review routine
For a regular business review:
- Resolve account or integration notices at the top.
- Check the 14-day direction of attributed revenue and conversations.
- Use the benchmark to understand attributed revenue as a share of total recorded revenue.
- Review Actions for unexpected drops, spikes, or missing monetary values.
- Check the campaign calendar for upcoming sends and recent results.
- Open the report that answers the specific question instead of comparing unrelated headline metrics.
For example, a rise in conversations with flat attributed revenue does not explain the cause. Open Performance to inspect conversion and escalation, Service quality to review resolution, and Revenue to inspect attribution sources.
Troubleshoot missing or unexpected data
If the Dashboard looks incomplete:
- Confirm the business and user timezone before comparing days.
- Verify the store or external system is still connected.
- Check that recent profiles, orders, conversations, and tracked events appear in Hellotext.
- Confirm customer and order identifiers allow activity to be connected to the correct profile.
- Review whether an external source had precedence over Hellotext attribution.
- Make sure you are comparing the Dashboard’s fixed 14 days with the same period in the detailed report.
Recent report results can change while attribution remains open or late data arrives. If the underlying event is missing, start with Troubleshoot missing signals or activity.